Eliminating Collection View Tearing with Xcode's Time Profiler Instrument
Using the Time Profiler to refactor collection view cell model image fetching and pull Parse's return call off the main thread enables smooth scrolling.
Dealing with complicated code paths involving DispatchQueue can lead to mistakes causing the main thread to be blocked when it shouldn't be.
In the video below, the 1.0 version of a toy photo gallery shows that scrolling is not as smooth as it might be in the gallery view, and we can outpace loading the images in the horizontal preview scroll.
### Resize the Assets Before Doing Anything Else...
I also was unhappy with the compression and resizing of the images in the thumbnails in version 1.0. Before checking into Xcode's Time Profiler instrument, I optimized my collection view image cells and the assets stored on S3. I wanted to make sure that the change in the lift would be measured between the unmodified code using the newly sized assets and the final refactoring for v1.1.
I determined the correct thumbnail size using iosres.com. Our largest thumbnails will potentially take up 2/3 of the width of the screen. The logical width of our largest iPhone screen is 414. 414 * 2 / 3 == 276 points. Our images need to be @3x scale to fill each pixel on that width, so 276 * 3 = 828 pixels wide.
I tried out PNG assets using sips, but the resulting image sizes were far too large.
for i in *.jpeg; do sips -s format png $i --out Converted/$i.png;done
Then I tried using lossless JPEG compression using some guides from the Mozilla JPEG Encoder Project and CJPEG Examples and Compressing JPEG images.
The script below gave me optimized assets:
INDEX=0
for FILENAME in *.jpeg; do
  echo $FILENAME
  mozjpegtran -optimise $FILENAME > "$FILENAME.optimized"
done
The images looked good, but the file sizes are not that small, so I ended up changing my script to use a compression quality of 85:
JPEG Compression Script
INDEX=0
for FILENAME in *.jpeg; do
  echo $FILENAME
  mozcjpeg -baseline -quant-table 2 -quality 85 -outfile "./converted/$FILENAME" $FILENAME
done
The image below shows the thumbnail image sizes before I made them 828 pixels wide and output them with a higher compression quality:

The file sizes actually went up by a factor of 5x after reconverting:

This should, in theory, slow things down even more because the download sizes are significantly larger, but it's worth it because my thumbnails looked a lot better:

Breaking out the Time Profiler
I found a few decent reference articles about the Time Profiler:
I used the following procedure to standardize my tests in the Time Profiler:
Time Profiling Test
- Delete the app on the test device
- Run the app with 'Profile' in Xcode
- Choose the Time Profiler in Instruments
- Run the app, without touches, for 40 seconds
- Stop and save
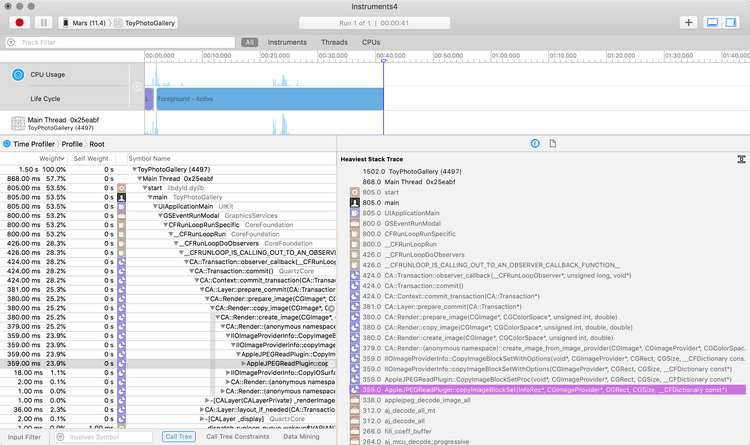
For comparison, I did not start testing with any scrolling. I just wanted to see what fell out of the data with no interaction at all during launch. So, with the unmodified code in version 1.0 using the new asset sizes, I got the following results in the Time Profiler:

The heaviest stack trace in this run was rendering the [JPEG images](https://gist.github.com/voxels/a7382d1146de6694a7b060abc788a1bb %).
About 58 percent of the weight was put onto the main thread. Loading completed around 20 seconds after launch. The second heaviest weight was located in the [ResourceModelController](https://gist.github.com/voxels/7931263db0250766e47b4f641fac3a74 %) .
About 17 percent of the weight was located in [Parse](https://gist.github.com/e96ee476379680a445cb22192fcc0c2a %).
Given the results above, it seemed like I needed to do some refactoring of the image cell model, the image cell view, and check into Parse.
Refactoring for Better Performance
I found some tutorials online that helped me understand some gotchas about collection views.
In order to improve the collection view scrolling, I did some work on the following:
- Move fetching and configuration of the thumbnail images out of the cell
- Avoid UIColor.clear and layer shadows in the cells
- Simplify the gallery collection view controller model array
- Audit the DispatchQueues
Emptying the images out of the cell's views changed the heaviest [stack trace](https://gist.github.com/44a81bcff2d684a7bcd400751cb1cb37 %).
The scrolling still seemed to be pausing, so I did some more digging and found out that even though Parse was being called on a background thread...

...it was in fact returning on the main thread:

This is no good because we had more model work to do on a background thread before trying to finish launch.
Debugging the DispatchQueues for parse and adding some safety around when to fetch and how to update the collection view resulted in a much better Time Profiler trace:

In version 1.1, the launch completes in under 8 seconds. We only have 37 percent of our work happening on the main thread.
For good measure, I ran some traces in the Allocations, Leaks, and Zombies instruments.

No serious issues popped up after refactoring.
The images below show the CPU and Memory dashboards in Xcode showing how well the app performs under a stress test:


CPU time spikes at launch and then remains pretty modest. Memory usage never climbs above 35 Mb even after all the images are loaded and lots of high intensity scrolling is thrown at the gallery and preview collection view layouts.
Comparing v1.0 and v1.1
In version 1.0, the toy photo gallery demonstrated pauses during scrolling, unoptimized thumbnails, and unrefined transition animations:
In version 1.1, the photo gallery has smooth scrolling, optimized thumbnails, and refined transition animations thanks to the Time Profiler.
©2023, Secret Atomics